At Wharf Gate (AWG) log prices across New Zealand dropped an average of 17% in April. April AWG log prices are about 15% below the two-year average. CFR prices for A grade logs in China has bottomed in the range of 110-116 USD per JASm3. Rising inventory levels in China have now stabilised and log demand has increased to around 75k m3 per day. Log supply from New Zealand has reduced about 25% in April.
Domestic demand for sawn timber is slowing down for winter, with very little forward orders. Sawmillers predict 2024 will be tougher than 2023.
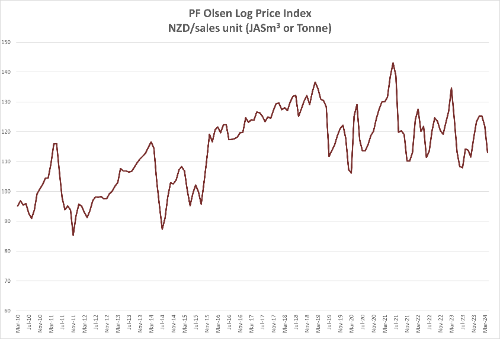
The PF Olsen Log Price Index dropped $9 in April to $113. This is $6 below the two-year average, and $8 below the three and five-year averages.
Domestic Log Market
Sawmills have seen local demand slow as we end the New Zealand summer. Mills report very low forward orders, indeed worse than this time last year. Demand from Australia is also very low.
Sales of sawn timber in Asia are solid, but these grades are always produced as arisings when cutting domestic grades. Therefore, while this market helps, it doesn’t sustain New Zealand sawmills without a solid domestic market.
Export Log Markets
China
China log inventory which had been rising through March, has now stabilised with softwood (which is mainly New Zealand radiata pine) levels at about 3.3-3.4m m3. Daily off-take has increased to about 75k per day, which is as healthy as the demand has been in the last couple of years. Market sentiment, however, remains weak with virtually everyone in the supply chain in China still struggling to consistently make a profitable margin. This increase in log buying seems to be more a reaction to wholesalers dropping prices rather than a fundamental increase in demand.
Log supply from New Zealand has dropped quickly in reaction to the lower AWG pricing levels, with 25% less log vessels in April than March. This is due to a combination of factors; wetter Autumn weather slowing down harvest, harvest jobs stopping or slowing due to price levels, volume now being sold in India, and less volume from the CNI windthrow. Log supply to China will slow down even more in May.
The sale price for A grade pine logs in China seems to have bottomed in the 110-116 USD range.
The China Caixin Manufacturing PMI increased from 50.9 in February to 51.1 in March. (Any number above 50 signals manufacturing growth). This was boosted by higher new orders from both domestic and abroad, which increased the most in over a year. Firms are still cutting selling prices to stimulate demand. Input prices fell marginally for the first time since July 2023, due to lower raw material costs.
India
Demand in Gandhidham for green sawn timber is steady with prices remining at INR 571 and INR 601 per CFT from timber from South America and Australian pine logs respectively.
The market anticipates three log vessels arriving at Kandla Port in May including one from New Zealand. Log Supply from South America is expected to reduce in May and June as Kandla traders are not prepared to pay the expected CFR prices to the log exporters.
Logs in containers from South Africa are not being shipped to India, due to an inability to fumigate because of methyl bromide supply issues. Logs from USA are also unduly delayed due to container supply problems.
In Tuticorin, Some containers are arriving from USA, Australia, and New Zealand with radiata pine logs. Green sawn timber is sold around INR 651 per CFT. In the last three months prices for kiln dried sawn timber from Europe has increased about 30%. This is due to an increase in log prices in Europe.
Indian demand for pine logs is expected to increase in Quarter 3, as the Parliamentary election results will be declared on June 4th and the new Central Ministry is formed after that. Labourers will return to sawmills from their villages, after voting, so production improves.
Exchange rates
The NZD has weakened then strengthened against the USD since April AWG prices were fixed. However, the NZD is now only slightly weaker against the USD so this will not have much impact on May AWG prices.
NZD:USD
CNY:USD
Ocean Freight
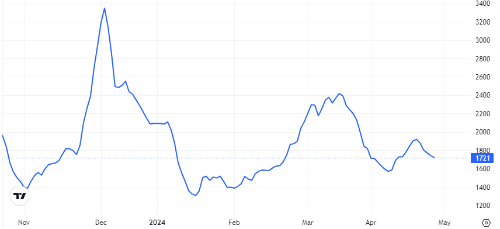
Recent decreases in freight costs for log vessels departing from New Zealand have reversed. Shipping costs from the North Island to China is now in the high 30's USD per JASm3, with Supramax cargoes above 40 USD. While the Baltic Dry Index (BDI) has trended downwards, this is heavily influenced by a reduction in demand for the larger vessels. The costs for smaller vessels such as Supramax has increased against the trend.
The BDI below is a composite composite of three sub-indices, each covering a different carrier size: Capsize (40%), Panamax (30%), and Supramax (30%). It displays an index of the daily USD hire rates across 20 ocean shipping routes. Whilst most of the NZ log trade is shipped in Handysize vessels, this segment is strongly influenced by the BDI.
Source: TradingEconomics.com
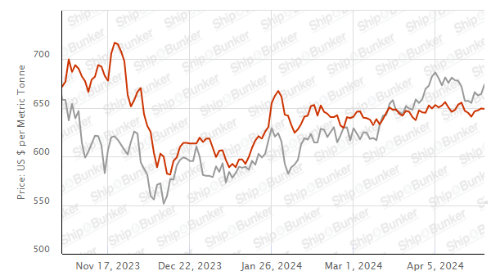
Singapore Bunker Price (VLSO) (red line) versus Brent Oil Price (grey line)
Source: Ship & Bunker
PF Olsen Log Price Index – April 202
The PF Olsen Log Price Index dropped $9 in April to $113. This is $6 below the two-year average, and $8 below the three and five-year averages.

Basis of Index: This Index is based on prices in the table below weighted in proportions that represent
a broad average of log grades produced from a typical pruned forest with an
approximate mix of 40% domestic and 60% export supply.
Indicative Average Current Log Prices – April 2024
| Log Grade | $/tonne at mill | $/JAS m3 at wharf | ||||||||||
| Apr-24 | Mar-24 | Feb-24 | Jan-24 | Dec-23 | Nov-23 | Apr-24 | Mar-24 | Feb-24 | Jan-24 | Dec-23 | Nov-23 | |
| Pruned (P40) | 175-200 | 175-200 | 175-200 | 175-200 | 175-200 | 175-200 | 170 | 185 | 196 | 196 | 190 | 180 |
| Structural (S30) | 120-145 | 120-145 | 122-145 | 122-145 | 120-145 | 120-145 | ||||||
| Structural (S20) | 93-100 | 93-100 | 94-100 | 94-100 | 93-100 | 93-100 | ||||||
| Export A | 108 | 128 | 135 | 135 | 134 | 125 | ||||||
| Export K | 99 | 119 | 126 | 126 | 125 | 116 | ||||||
| Export KI | 90 | 110 | 117 | 117 | 116 | 107 | ||||||
| Export KIS | 81 | 101 | 108 | 108 | 107 | 98 | ||||||
| Pulp | 46 | 46 | 46 | 46 | 46 | 46 | ||||||
Note: Actual prices will vary according to regional supply/demand balances, varying cost structures and grade variation. These prices should be used as a guide only.
A longer series of these prices is available here.
Log Prices
Select chart tabs
This article is reproduced from PF Olsen's Wood Matters, with permission.


We welcome your comments below. If you are not already registered, please register to comment.
Remember we welcome robust, respectful and insightful debate. We don't welcome abusive or defamatory comments and will de-register those repeatedly making such comments. Our current comment policy is here.