
Domestic Log Market
There is strong demand for good quality pruned and structural logs. The NZ structural mills have manged to increase lumber prices for domestic sales a couple of times in 2017 and still maintain solid demand. The lumber market in Australia has softened for a variety of reasons. Their housing starts are down, there have been weather interruptions and some poor grade recoveries. Demand from the Asian markets has remained strong for NZ sellers, even allowing for increased supply from Russian mills. The NZ mills have benefited by the weakening NZD against the USD.
Export Log Market
China
Since I started writing this market column at the start of the year it has been a stable period for the China log market. From the start of the year I expected small variations in AGW returns for forest owners due to fluctuations in shipping and foreign exchange rather than any log market movement, and for the most part this has been the case
Long may this boring period last!. Most exporters were recently able to increase CFR prices in China due to Chinese concerns about low weather related April log production in NZ. C3 handle port operations for approximately 2/3rds of NZ’s export logs and Matt Wakelin (Central Region Manager) estimates that in the two rain affected weeks in April cart-in was down by about 20% around the country.
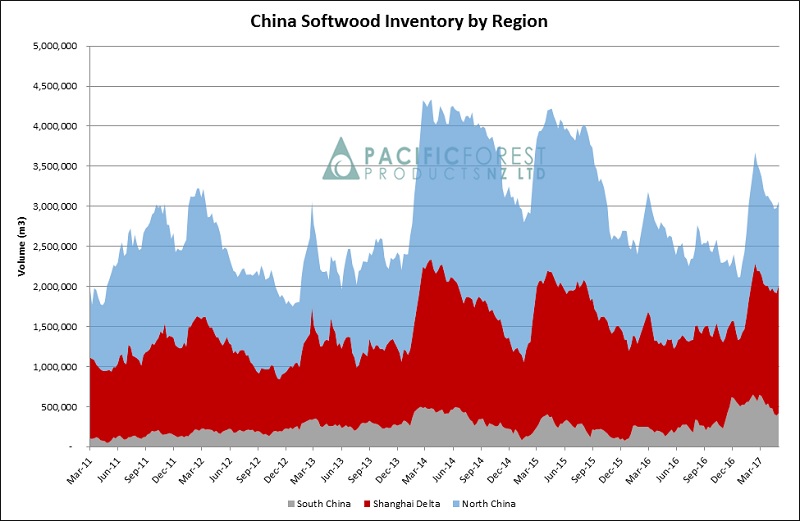
Pacific Forest Products (PFP) report that China daily offtake is around 60,000m3 per day and that the market remains well-balanced with total log inventory at 3.02 mill m3 and stable. Inventory is forecast to continue to slowly deplete over the next few months. The Chinese authorities will reduce the import VAT on log imports from 13% down to 11% from 1 July. Their reasoning is that with the reduced domestic harvest they need to encourage higher volumes of log imports to help satisfy demand. This is another positive sign for the future of log exports to China from NZ. As well as putting another backstop behind current market pricing, this is evidence of a positive sentiment in China from central government towards importers and end-users of NZ logs.

China Log Inventory. (Courtesy of PFP)
India
There are signs of recovery in the Indian log market after their currency demonetization, and this market is approaching stability and approaching parity with China prices. Interestingly, the Indian government added 9.1 million new taxpayers in 2016-2017, which is an 80% increase over the typical yearly rise. Allowing for deaths and retirements etc this means total taxpayers increased about 4.1 million. The Indian government has a target to increase the tax base to 100 million taxpayers from the current 65 million individuals. This is expected to significantly boost the government’s tax revenue. If some of this revenue was to be spent in infrastructure this would increase demand for logs.
Ocean Freight
The ocean freight prices have now plateaued after rising from high teens in February to low-mid USD 20’s in April. The increased demand for freight outlined in the March Wood Matters has reduced and the balance between available tonnage and demand has improved. Bunker costs have reduced by about 10% to $300/t due to oil price falls. Weight factors will increase as we move into the winter months placing a small upward pressure on shipping costs.
Foreign Exchange
The NZD relative to the USD has recently remained in the 0.69-0.70 range, even dipping below 0.69 occasionally.
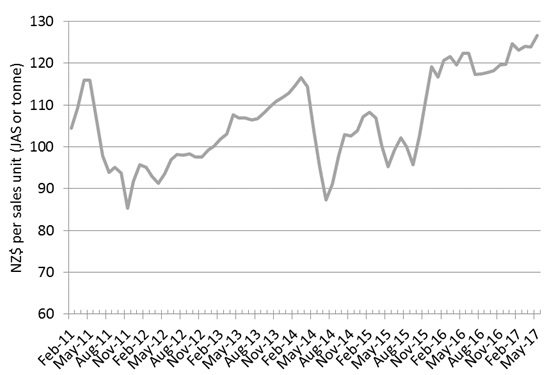
PF Olsen Log Price Index to May 2017
With both strong export and domestic log prices the index has reached an all-time high since we started this index in February 2011. The index is now $11 higher than the two-year average, $16 above the three year average and $18 higher than the five-year average.

Basis of Index: This Index is based on prices in the table below weighted in proportions that represent a broad average of log grades produced from a typical pruned forest with an approximate mix of 40% domestic and 60% export supply.
Indicative Average Current Log Prices – May 2017
| Log Grade | $/tonne at mill | $/JAS m3 at wharf | ||||||||
| May-17 | Apr-17 | Mar-17 | Feb-17 | Dec-16 | May-17 | Apr-17 | Mar-17 | Feb-17 | Dec-16 | |
| Pruned (P40) | 188 | 188 | 187 | 187 | 187 | 180 | 185 | 179 | 185 | 172 |
| Structural (S30) | 113 | 113 | 112 | 112 | 112 | |||||
| Structural (S20) | 103 | 103 | 102 | 102 | 102 | |||||
| Export A | 141 | 136 | 137 | 135 | 128 | |||||
| Export K | 134 | 129 | 130 | 128 | 120 | |||||
| Export KI | 126 | 121 | 121 | 119 | 109 | |||||
| Pulp | 50 | 50 | 50 | 50 | 50 | |||||
Note: Actual prices will vary according to regional supply/demand balances, varying cost structures and grade variation. These prices should be used as a guide only..
This article is reproduced from PF Olsen's Wood Matters, with permission.
We welcome your comments below. If you are not already registered, please register to comment
Remember we welcome robust, respectful and insightful debate. We don't welcome abusive or defamatory comments and will de-register those repeatedly making such comments. Our current comment policy is here.